
Data Analytics Consultant
GraphStateVis: Interactive Visual Analysis of Qubit Graph States and their Stabilizer Groups
Fathoming out quantum state space is a challenging endeavor due to its growing dimensionality. At the expense of being bound in its expressiveness, the and finite subspace of graph states is easier to investigate via a pictorial accompanied with a theoretical toolkit from the stabilizer formalism.
Analyzing hand-drawn graphs is a tedious and time-consuming task and imposes limitations to the problem sizes that can be addressed. Similarly, algorithmic studies using adjacency matrices alone lack the benefit of a visual representation of the states.
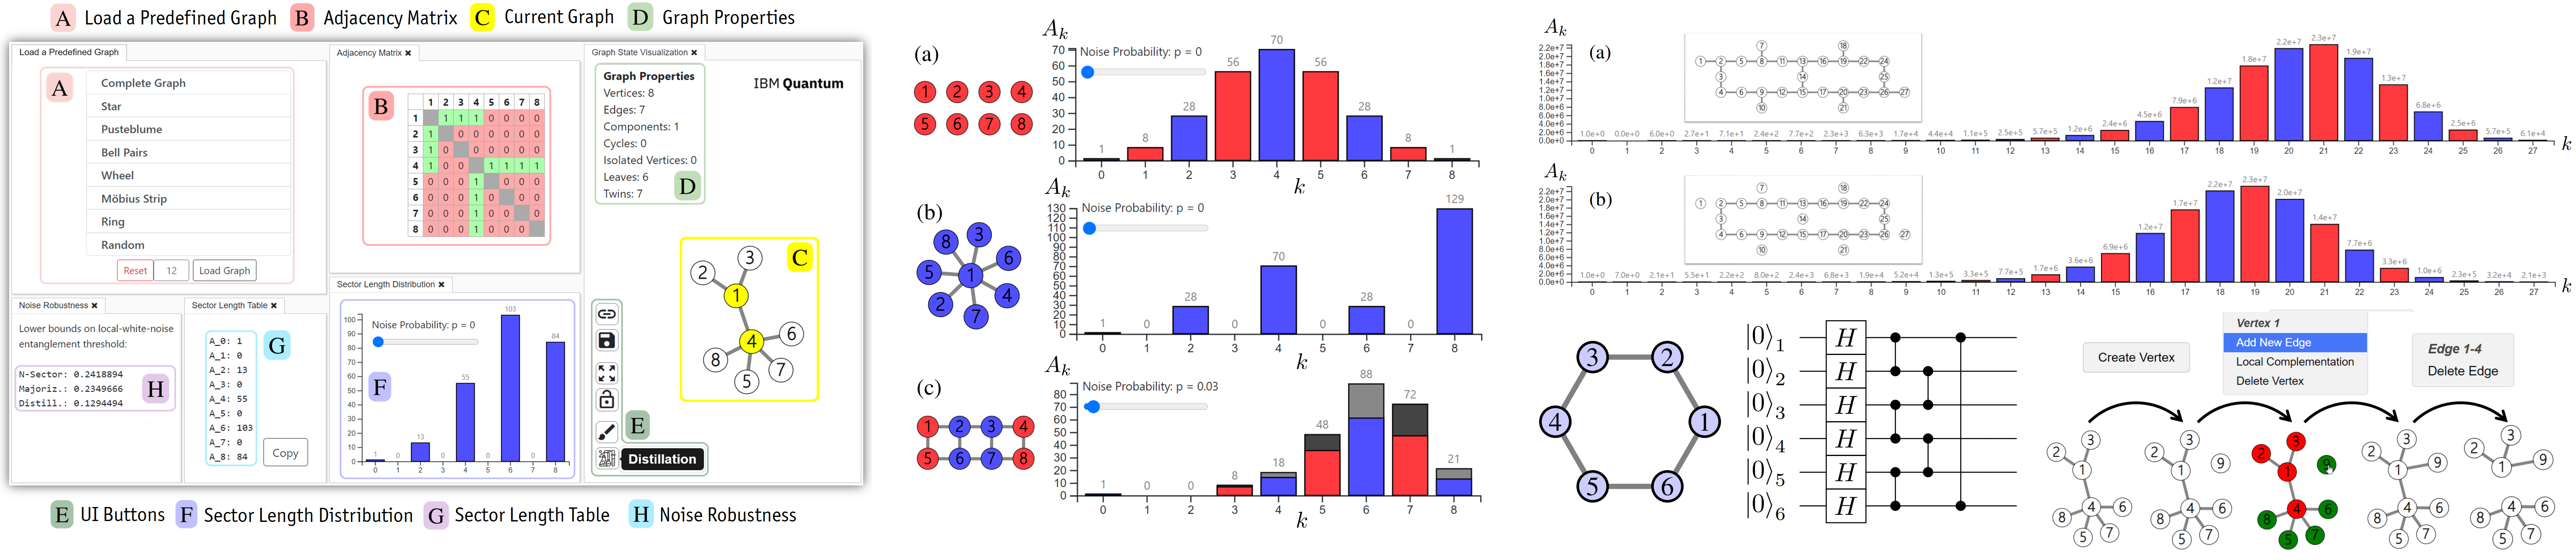
We argue that applying visual analytics to investigate graph states can be advantageous. To this end, we introduce GraphStateVis, a web-based application for the visual analysis of qubit graph states and their stabilizer groups. Our tool facilitates the interactive construction of a graph through multiple components supported by linking and brushing.
The user can explore graph-state-specific properties, including the Pauli-weight distribution of its stabilizer operators and noise thresholds for entanglement criteria. We propose a use case in the context of near-term quantum algorithms to illustrate the capabilities of our prototype.
We provide access to GraphStateVis as an open-source project and invite the broader quantum computing and engineering communities to take advantage of this tool and further boost its development.
@inproceedings{miller:2021:graphstatevis,
  author    = {Matthias Miller and Daniel Miller},
  title     = {{GraphStateVis: Interactive Visual Analysis of Qubit Graph States and their Stabilizer Groups}},
  booktitle = {{IEEE} International Conference on Quantum Computing and Engineering},
  pages     = {378--384},
  publisher = {{IEEE}},
  year      = {2021},
  doi       = {10.1109/QCE52317.2021.00057}
}