
Data Analytics Consultant
Augmenting Digital Sheet Music through Visual Analytics
Music analysis tasks, such as structure identification and modulation detection, are tedious when performed manually due to the complexity of the common music notation (CMN). Fully automated analysis instead misses human intuition about relevance.
Existing approaches use abstract data-driven visualizations to assist music analysis but lack a suitable connection to the CMN. Therefore, music analysts often prefer to remain in their familiar context.
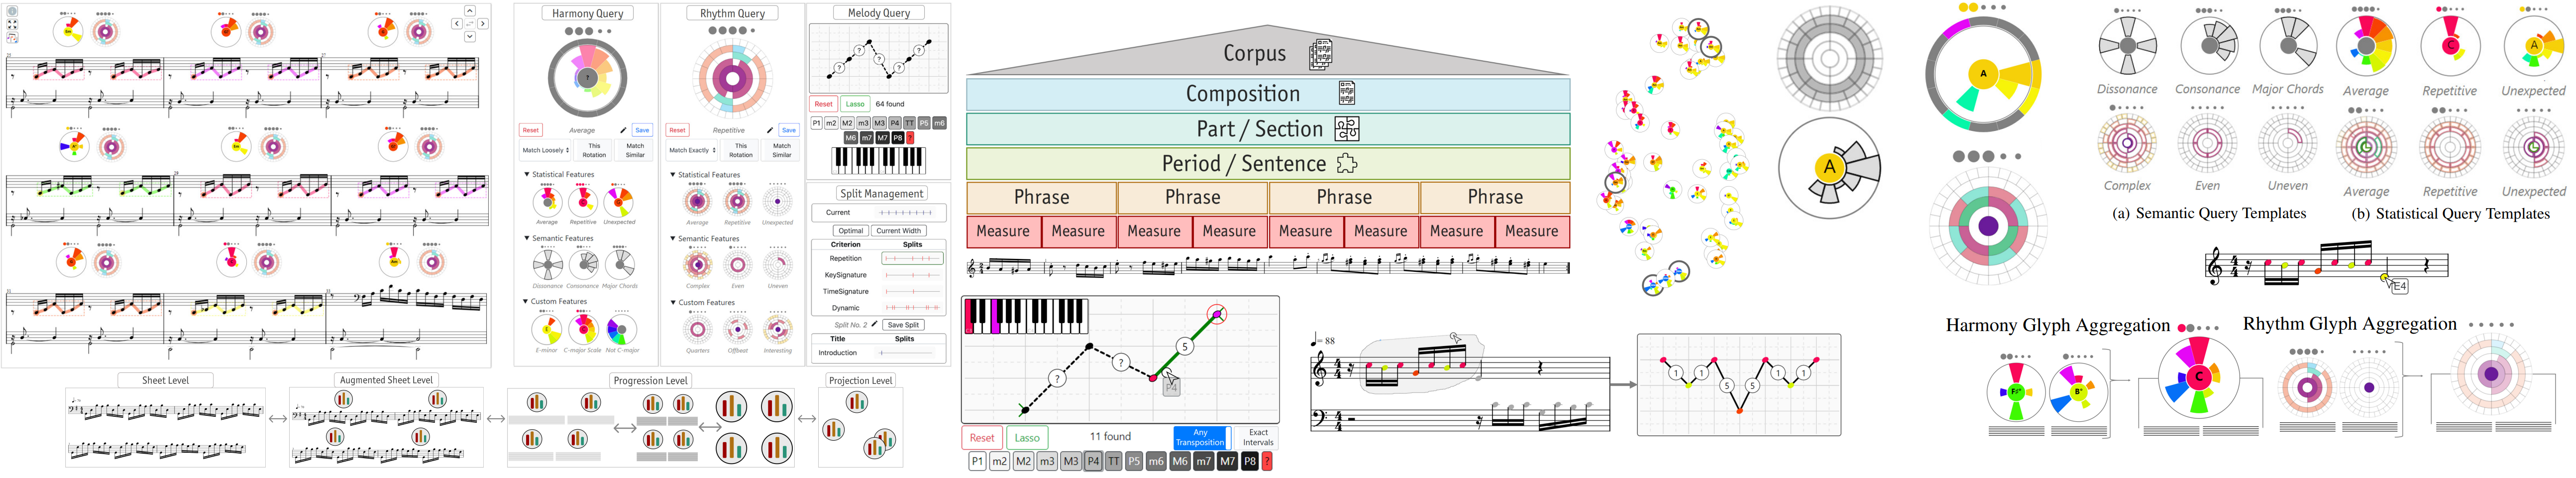
Our approach enhances the traditional analysis workflow by complementing CMN with interactive visualization entities as minimally intrusive augmentations. Gradual step-wise transitions empower analysts to retrace and comprehend the relationship between the CMN and abstract data representations. We leverage glyph-based visualizations for harmony, rhythm and melody to demonstrate our technique's applicability. Design-driven visual query filters enable analysts to investigate statistical and semantic patterns on various abstraction levels.
We conducted pair analytics sessions with 16 participants of different proficiency levels to gather qualitative feedback about the intuitiveness, traceability and understandability of our approach. The results show that MusicVis supports music analysts in getting new insights about feature characteristics while increasing their engagement and willingness to explore.
@article{miller:2022:musicvis,
  author    = {Matthias Miller and
               Daniel F{\"{u}}rst and
               Hanna Hauptmann and
               Daniel A. Keim and
               Mennatallah El{-}Assady},
  title     = {{Augmenting Digital Sheet Music through Visual Analytics}},
  journal   = {Comput. Graph. Forum},
  volume    = {41},
  number    = {1},
  pages     = {301--316},
  year      = {2022},
  doi       = {10.1111/cgf.14436}
}