
Data Analytics Consultant
Visualization of COVID-19 Incidences and Treatment Capacities with CoronaVis
The COVID-19 pandemic and its rapid development within a few weeks place completely new demands on the analysis of infection statistics.
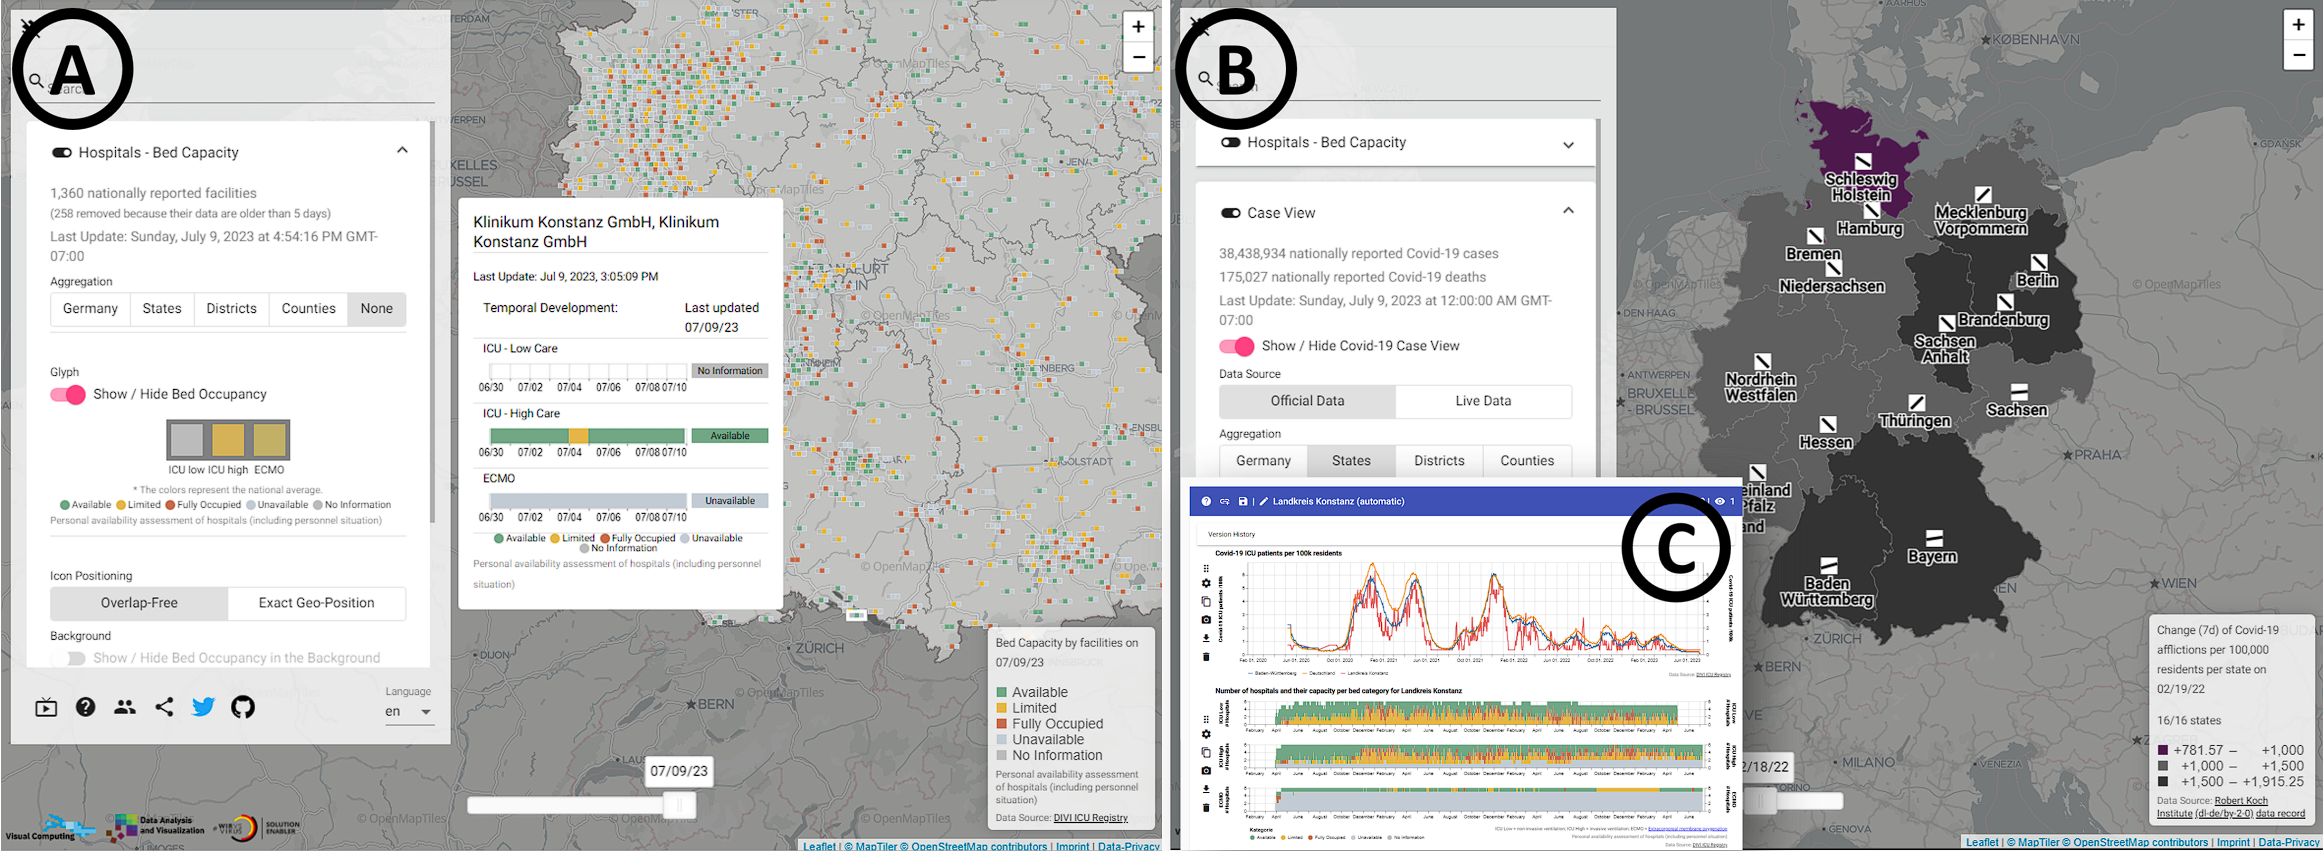
CoronaVis provides interactive visualizations through which case incidences and bed capacities of intensive care units (ICUs) across Germany can be analyzed.
CoronaVis is primarily designed to support physicians, crisis teams, and medical decisionmakers and to enable informed decisions, for example, on patient distribution in the event of impending overload. CoronaVis scales from the local to the national level through flexible aggregation capabilities.
This paper introduces the analytics capabilities of CoronaVis and takes a closer look at the power of interactive visualizations in supporting dynamic situations.